School me on C and W tapers behavior

thomasbe86

Well-known member
I am trying to find the best fit for a potentiometer within my circuit, but really, in simulation I only ever use A and B taper... I never really understood how the others work...

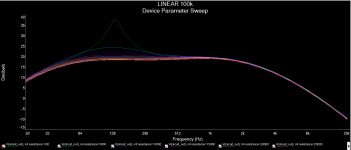
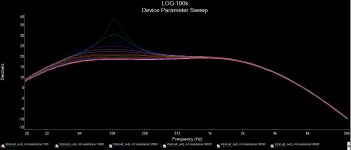
Here are the graphs with both tapers; I am greedy and looking for a more precise transistion on the early course of the pot, like "extra" log...
Basically; the lower the resistance, the louder the hump at 130Hz
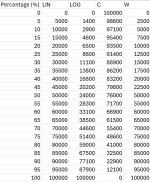
Can anyone give me a clue on what each value would look like for C and W tapers? table at the end is what ChatGPT told me they behave like for a 100k pot, not sure this sounds correct...


1732378619567.png
1732378639147.png


1732379370478.png
 
It’s easier to show graphically. C tapers are the opposite of A tapers, where the resistance increases quickly then slows down as you turn clockwise. K tapers are a hybrid of linear and logarithmic(?) where half the sweep mimics one taper then switches to the other. Any taper pot will work in any given circuit as long as the value is correct. The difference is how it behaves as you turn it. Some linear pots don’t do much until the last quarter turn. C tapers would be a good substitution there.

 
Ok, so confirmation on what I showed on the table for C taper, which makes the graph look like this, exactly the opposite of what I'd love:
Has anyone ever managed to simulate an "extra" log taper? I tried several combinations with different tapers and resistors in parallel but this just makes it worse....
1732381684564.png
 
1732419351199.png
1) is your standard linear "B" taper,
2) is your standard logarithmic or "audio" "A" taper (which is ironic because that curve is not a logarithmic function),
4) is the reverse-log or "C" taper (which is really more like a logarithmic function),
5) is a "W" taper, sort of sigmoidal where you have a reverse-log taper from 0-50 and a log taper from 50-100.
 
These graphs are straight outta the Alpha datasheet.

A-taper is otherwise known as log or audio taper. Yes, as drawn they look more like an exponential curve, which is the inverse of log. It's not a true log (or exponential) curve; it is an approximation. It's basically linear from 0% to 50% rotation, and a steeper linear slope from 60% to 100% rotation with a smooth-ish transition from one slope to the other. This is simply how they make pots. The A-taper pots we buy from Small Bear, Stomp Box Parts, Tayda, etc. are 15% taper, which means at 50% rotation, the divider ratio is 15%. "Vintage" guitar pots are more like 25% or 30% taper. Fender uses various tapers in their amplifiers, as noted on the factory schematics. Note that the vertical axis is resistance divider ratio. Not resistance ratio.

1742913169732.png

Alpha calls this next graph "B series." It includes B-taper and W-taper. W-taper is marked "4B(W)."

1742913693451.png
Here's C-Taper. It's a mirror-image of A-taper. Again, the pots we buy for pedals are 15% taper.

1742914727840.png
For simulations, I used these plots to create piece-wise approximations of the various tapers.

A-taper:
.step param A list 0 0.03 0.06 0.09 0.12 0.15 0.32 0.49 0.66 0.83 1

C-taper:
.step param C list 0 0.17 0.37 0.51 0.68 0.85 0.88 0.91 0.94 0.97 1

W-taper:
.step param W list 0 0.015 0.03 0.10 0.25 0.50 0.75 0.90 0.97 0.985 1.00

I then use the params to scale the two halves of a potentiometer.

{100K*A+1}
and
{100K*(1-A)+1}

It's not super accurate, bit it's close enough for Rock & Roll.
 
Back
Top