This will probably only interest a small cross-section of people who are interested in FV-1 coding the FV-1 line by line, and who like making waveform signals in Microsoft excel. Let me know if I'm not alone in that cross-section...
When I want to understand how a block of FV-1 code works, particularly filters, I've developed this technique in excel:
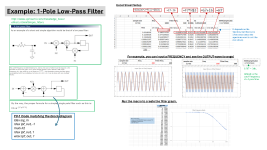
--Setup a column for time (at the 32768 sample rate), up to maybe 1500 or 2000 rows.
--Setup a column for a sine wave (which references a fixed cell for the frequency). [signal = sin(2*pi*F*t)]
--Setup columns that perform the same math functions as the FV-1 code block. Use fixed cells for variables such as kf, kq, etc.
--Graph the input & output. For example, if a filter is reducing a frequency, then you can see the output is smaller than the input. You can also see the phase shift.
--Next, set a cell to read the MAX (or amplitude) of the output column. (Be sure to ignore the first chunk of data (maybe even the first 1000 rows) since that can give false maximums as the filter gets going)
Now the fun part:
--create a column of Frequencies you want to check. This is like feeding a Sine Sweep audio to the code.
--Highlight the column of frequencies and run a MACRO that:
----For each frequency, sets the sine wave frequency cell to that value. (Excel automatically updates all the column calculations for each frequency while the macro is running)
----reads the MAX cell and writes that in the column next to the frequency column.
Graph this to see a visualization of the filter! Logarithmic scale graph tends to give more relevant audio information.
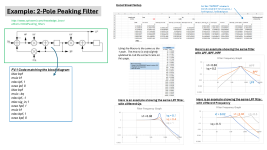
I've attached slides explaining the method and some results for 1-pole and 2-pole filters, but this concept could be applied to any FV-1 function. For example, I've done a little bit with phaser code, and you can see what frequencies get cancelled.
Alternate (maybe better) methods include doing all the math within an excel macro, or use MATLAB (or a free alternative). Or... it's possible that SPINCAD simulator already has some of this functionality? At least, capturing input vs output data? I need to get more familiar...
So, is any of this necessary?
-Can't I just use the SPINCAD blocks which have variables for frequency, Q, etc?
--Does it even matter what the graph looks like, since all that matters is the sound?
I have no good answers... other than I like to see what's going on, especially for the 2-pole filters. Also, hard-coding the math into excel really furthers familiarity with the DSP concepts.
Message me if you're interested in the excel files.
When I want to understand how a block of FV-1 code works, particularly filters, I've developed this technique in excel:
--Setup a column for time (at the 32768 sample rate), up to maybe 1500 or 2000 rows.
--Setup a column for a sine wave (which references a fixed cell for the frequency). [signal = sin(2*pi*F*t)]
--Setup columns that perform the same math functions as the FV-1 code block. Use fixed cells for variables such as kf, kq, etc.
--Graph the input & output. For example, if a filter is reducing a frequency, then you can see the output is smaller than the input. You can also see the phase shift.
--Next, set a cell to read the MAX (or amplitude) of the output column. (Be sure to ignore the first chunk of data (maybe even the first 1000 rows) since that can give false maximums as the filter gets going)
Now the fun part:
--create a column of Frequencies you want to check. This is like feeding a Sine Sweep audio to the code.
--Highlight the column of frequencies and run a MACRO that:
----For each frequency, sets the sine wave frequency cell to that value. (Excel automatically updates all the column calculations for each frequency while the macro is running)
----reads the MAX cell and writes that in the column next to the frequency column.
Graph this to see a visualization of the filter! Logarithmic scale graph tends to give more relevant audio information.
I've attached slides explaining the method and some results for 1-pole and 2-pole filters, but this concept could be applied to any FV-1 function. For example, I've done a little bit with phaser code, and you can see what frequencies get cancelled.
Alternate (maybe better) methods include doing all the math within an excel macro, or use MATLAB (or a free alternative). Or... it's possible that SPINCAD simulator already has some of this functionality? At least, capturing input vs output data? I need to get more familiar...
So, is any of this necessary?
-Can't I just use the SPINCAD blocks which have variables for frequency, Q, etc?
--Does it even matter what the graph looks like, since all that matters is the sound?
I have no good answers... other than I like to see what's going on, especially for the 2-pole filters. Also, hard-coding the math into excel really furthers familiarity with the DSP concepts.
Message me if you're interested in the excel files.